Reflecting on 5+ Years at New York City Transit
I recently left my role at New York City Transit to move to Washington D.C. As part of leaving, I wrote an article for my old department's newsletter, which I've adapted to remove some names/details and republished it.
I recently left my role at New York City Transit to move to Washington D.C. As part of leaving, I wrote an article for my old department's newsletter, which I've adapted to remove some names/details and republished below.
On my first day at New York City Transit, the speaker at orientation welcomed us to the “Last first day you will ever have.” While it was intimidating for me coming out of graduate school into my first real full time job, I was also excited to see where the job might take me. Even if I didn’t get to stick around until retirement, I still feel very lucky to have worked with a lot of great teams on a lot of important projects over the last 5 years.
I started working in Operations Planning (OP) under T. on the Operations Research team in Systems Data & Research (SDR). I had never worked with SQL before (the programming language/tool we used for much of our data analysis work), and he had just heard reports that a Staten Island express bus operator was stopping off the expressway in New Jersey. As a first learning project, he had me look at our archives of BusTime data to try and see if it looked like the reports were true. While I learned a lot about both SQL and BusTime data (NYCT's Realtime data feed with GPS pings every 30 seconds), there was too much noise in the GPS data to say for certain whether the bus was getting off the highway. I may not have uncovered a nefarious plot to pick up extra passengers in New Jersey, but the project did a great job foreshadowing the kind of work I would do for much of the next 5 years.
Saving Electricity on the 7 Line
A few weeks after I started, T. let me know that we had just gotten access to a new electricity data set from MTAHQ with 15 minute interval data from every electrical substation that powered the 3rd rail around the system. While another analyst had done some initial work looking at electricity usage on the 6 line, we wanted to investigate further and see if we could find any opportunities for energy savings. After assigning approximate station boundaries to each of the substations (most of the 3rd rail in the system is covered by at least 1 other substation for redundancy), we performed a regression analysis looking for the largest drivers of electricity use.
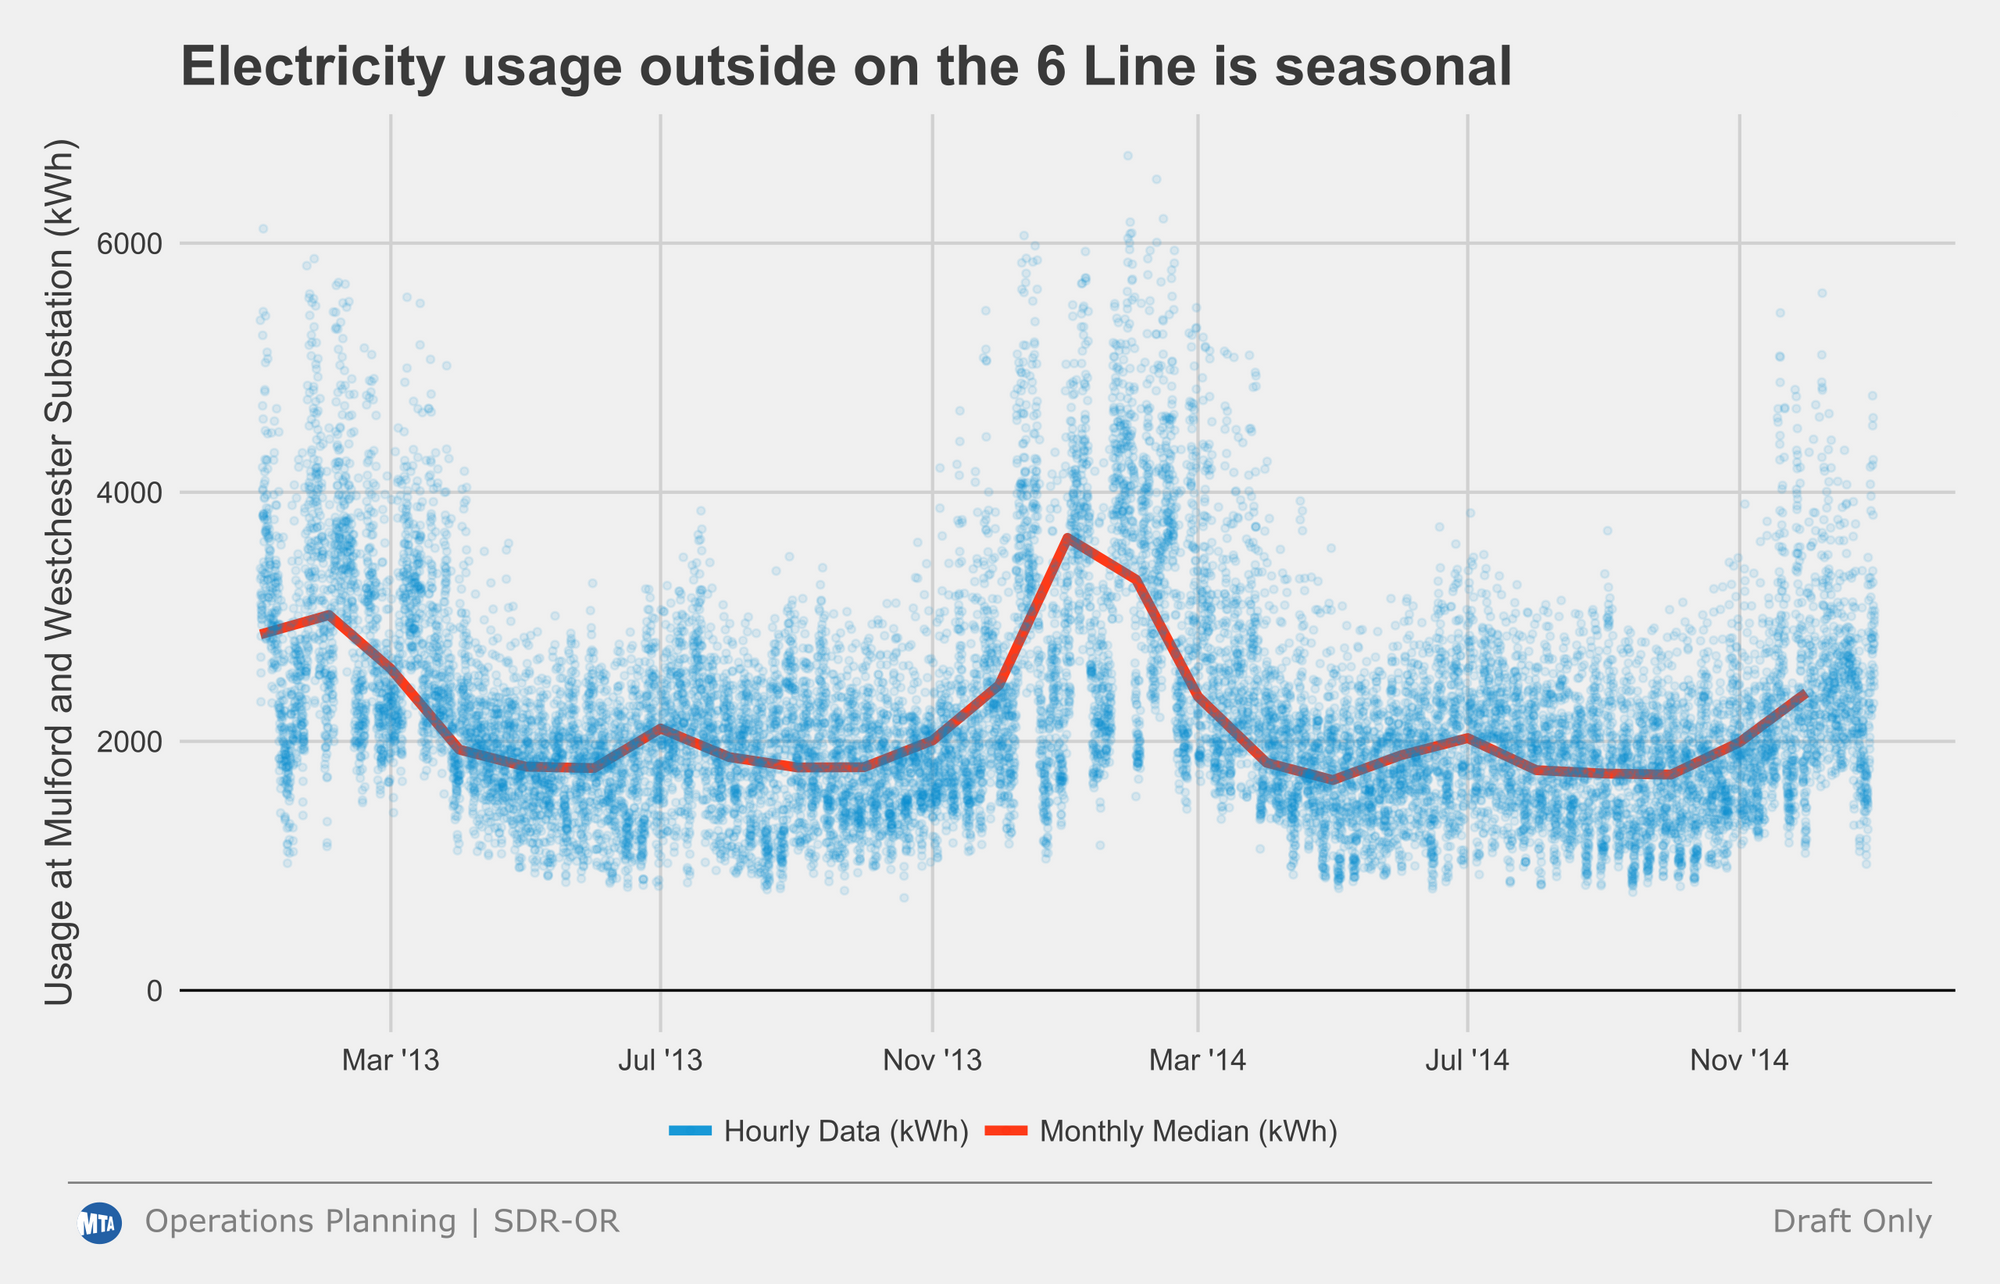
The data analysis showed there were two primary drivers of electricity usage: accelerations from station departures and the difference between the indoor temperature of the train and the outdoor temperature. While there is little to do in the short run about how much electricity a train uses when it accelerates (or so I thought), making the indoor temperature of the train closer to the outdoor temperature is much easier. The temperature relationship only existed on outdoor sections of track, so we decided to focus in on the 7 line with a pilot to reduce the temperature in the winter by 3 F, the time of year when the train temperature differs the most from the outdoor temperature. Before the pilot, I estimated this small change would save about 300 homes’ worth of electricity per day.
A year later we tried to follow-up to see if it was successful, but the data feed had broken in the meantime. Two years later we finally had access to the data feeds again, but the results showed we were using more electricity instead of less. After initially thinking T. and I had wasted a lot of money and employee time on a failed pilot, a deputy chief in the department helpfully pointed out that the 7 line had switched to Automatic Train Protection Mode (ATPM), allowing for faster accelerations (i.e. higher electricity use). In the end, we reran the regression on more recent data and still think the pilot was successful, although admittedly the benefit was much smaller than the increase in electricity use under ATPM.
Bus Speeds
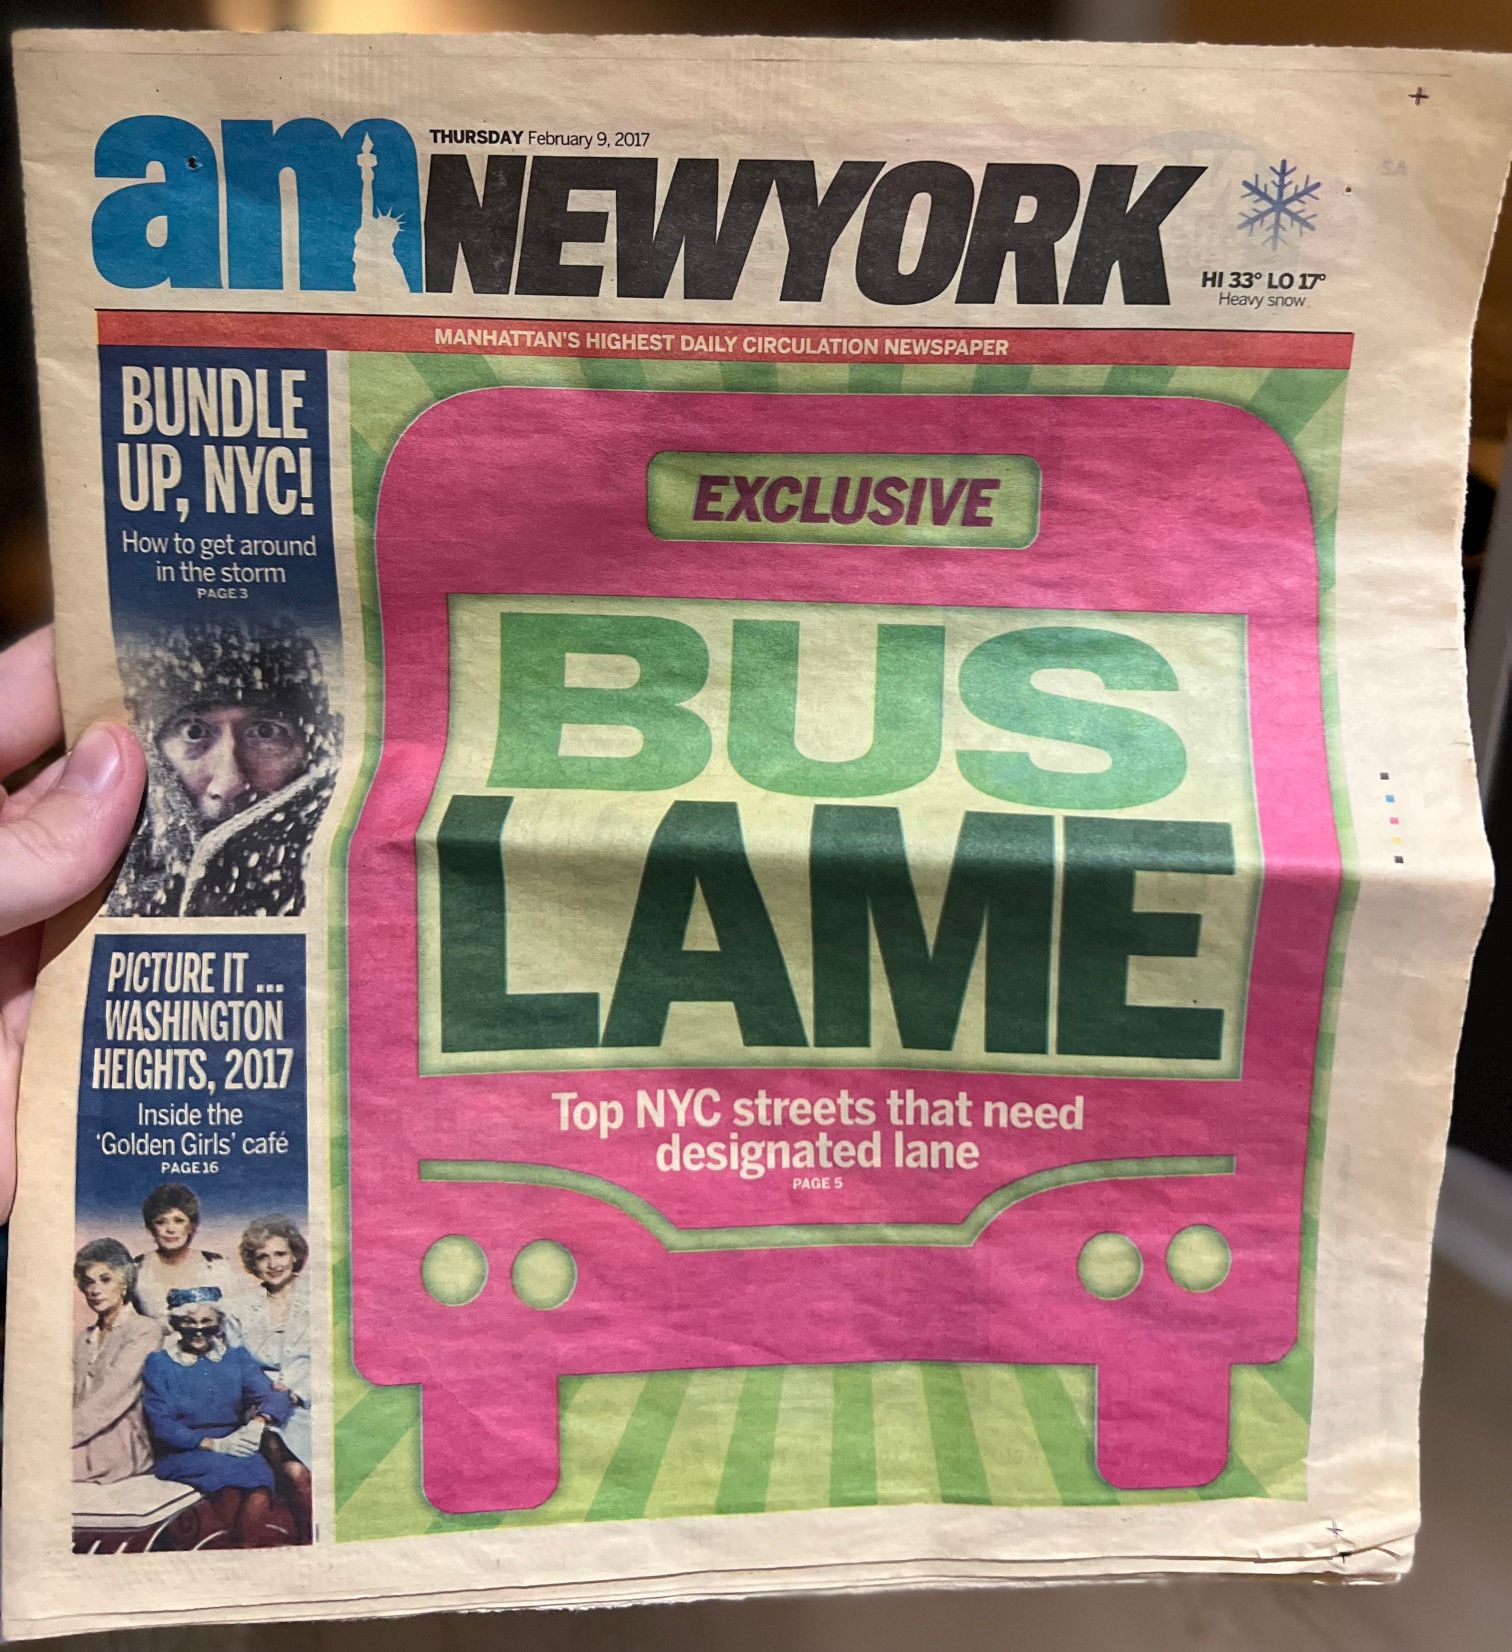
Following the electricity project, my first real project at NYCT was developing a systemwide bus speed metric based on BusTime data. Thankfully the other folks in SDR had put together a processed data set with one row for each stop at a timepoint on every trip. With a lot of advice and patience from the folks in my aisle, I developed a process to calculate timepoint to timepoint and route level bus speeds. This was just around when NYCDOT was launching its Bus Forward initiative. Working with the Bus Service Planning group in OP, another analyst and I went through all timepoint to timepoint segments in the system and ranked them by which slowed the most during the day compared to overnight hours, manually looking at many slow segments on Google Street View to determine how difficult it would be for DOT to put in improvements to speed up buses. This project was particularly special to me, since it was the first time data I had helped create something that appeared in public reports, and I still have the AMNY from the day when my data first showed up in the newspaper, titled “Exclusive: Bus Lame!”
The bus speed metric eventually made its way into the MTA Board book as well as the bus public dashboard, and it became a normal part of Bus Service Planning’s process for evaluating the effects of both service changes and NYCDOT street interventions. Although my team was never directly responsible for the improvements themselves, it was always so much fun to deliver the good news about speeding up the bus after a large project, like when the 14th St busway opened.
Fare Evasion
Starting in summer 2017 when a Postgrad was leaving, T. asked me if I would be interested in taking over maintenance of the Fare Evasion sample. At the time, I thought I would just need to make sure the sample generation process continued to run smoothly, and perhaps automate a few of the steps. While many folks at Transit don’t always realize this, the primary goal of the fare evasion sample is to ensure we can correctly estimate the number of bus and subway riders for service planning and federal reporting (which influences federal funding). An articulated bus with 110 riders on it is going to feel crowded, regardless of how many of them paid or not, and both bus and subway schedulers in OP need to have crowding information that is as accurate as possible.
The sample at the time (the subway sample still works this way) relied on checkers in plainclothes to manually count fare evaders while also categorizing the type of evasion. We quickly found a few errors in the sampling methodology (the group was reporting error margins assuming it was a simple random sample instead of a one-stage cluster sample), and shortly after I took over, the fare evasion rate started to tick upwards. While the MTA's Department of Security had always been one of the customers of fare evasion rates, their focus on fare evasion increased substantially when the subway fare evasion rate ticked above 2%.
With the increase in fare evasion, we were asked to work on the first of many “special studies”, typically designed to evaluate the impact of enforcement (by NYPD on subways and the Eagle Team on buses) on evasion rates throughout the system. The most notable of these samples was one that one of my analysts and I developed for 86th St on the Lexington Avenue Line. We observed the station for three months, tracking how evasion trended compared to systemwide rates for 3 weeks before an enforcement surge, 3 weeks during the surge, and 3 weeks afterward. Unfortunately, as of writing I don't think the MTA has published the results publicly so I'll refrain from summarizing them, but we used a logistic regression model to help identify the impact of different factors on the likelihood that an individual fare evades, and used LASSO to reduce the variables to just those that were important, all of which was really cool in spite of the subject matter.
Following an audit in 2018 from the MTA Inspector General's office that identified several weaknesses with our fare evasion methodology, we adjusted it collaborating with a professor from Columbia University. As of writing, NYCT uses a “stratified random cluster sample” to estimate Subway Fare Evasion. On the bus side, starting In January 2021, we transitioned to comparing Automated Passenger Counters (APCs) with fare payment data to collect bus fare evasion information instead of relying on manual surveys.
Board Reporting, Operations Improvement, Strategic Initiatives, MTA Data & Analytics...
After a few years of working in SDR (later renamed to Data, Research, and Development), I was looking to move to a different position and take more official ownership of some of the processes that I had been maintaining. I applied for a management role on a sibling team called Operations Improvement & Analysis (OIA), and while HR didn’t agree that I was qualified, I took over as the acting manager of Reporting Analytics. The role was an incredible learning experience for me—we had to make sure that data and metrics were processed and ready to go every weekday to make sure operations folks, admin staff, and executives all had the information they needed without interruption to make informed decisions.
Thankfully the two analysts who reported to me were both fantastic, which meant I had time to focus on process improvements while trusting them to take care of much of the daily work, letting me know when things went wrong. In many ways reporting is a thankless job, and most end users of reports only reached out to complain when data was missing or incorrect. Recurring events like board meetings and data bugs can also make it difficult to make improvements when you know the first week of each month will be eaten up by putting together board materials. That said, reporting work was also an opportunity for me to work more closely with executives while simultaneously getting closer to the operation. Even though most users didn’t care that we automated board report production or improved our data pipeline reliability, they did appreciate they could rely on reports to arrive regularly (most of the time).
Reporting After COVID-19
When the city closed in March 2020, many of the assumptions behind our data pipelines didn’t apply anymore. There were a lot of late nights troubleshooting new bugs that COVID service changes introduced into our metric calculations, but I am extremely proud of the work that our team did to make sure that decision makers at all levels of the MTA could make informed choices and see the results of their actions quickly. With the help of other members of OIA, we developed a series of new daily reports that provided detailed information on late night bus service while the subway was shut down, as well as new higher-level reports to outline the effectiveness of the new busways.
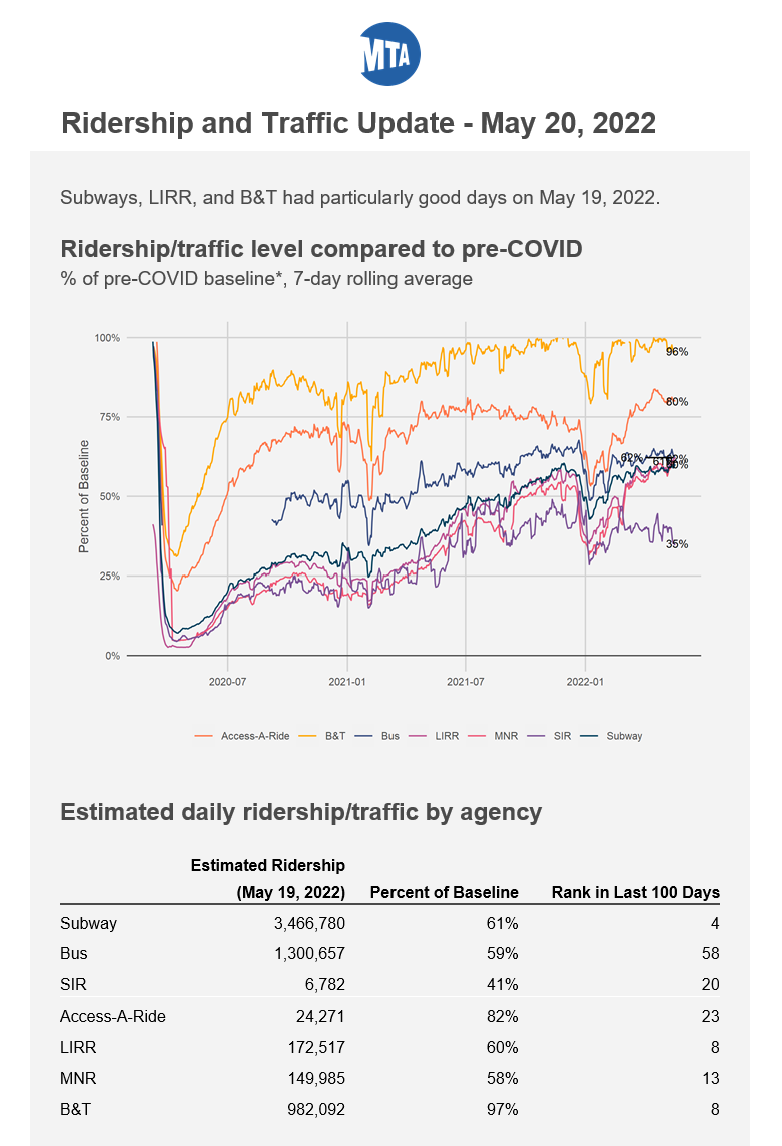
My team moved to NYCT Strategic Initiatives in January 2021, and we wound up taking on many new reporting duties as part of the transition (although I had a third great analyst by this point too). We helped develop a weekly mask compliance sample/email report, a daily subway executive brief with all the information higher-ups need to avoid being caught off-guard at a press conference, and a daily ridership email (screenshot below) which provides everyone with information on how well ridership is doing compared to pre-COVID (archive.org link). All three of these reports were quite popular almost immediately, and it reminded me that meeting your users where they are (e-mail in this case) and taking the time to design attractive reports makes a big difference to how people look at your results (I may have written about this previously...).
Closing Thoughts
I want to give a massive shoutout to everyone who took a chance on me and helped me over the past 5+ years. Not just my supervisors T., AB., and AK., but also all of my team members who have indulged my chattiness, particularly all four of my direct reports. I wouldn't be where I am without all of them.
There are several projects I didn’t discuss in detail above to save on space in the original article that I enjoyed as well: working with (and project managing for a short while) the SPEED team, developing a list of long and slow neighborhood to neighborhood bus trips (as seen in the NYC Bus Forward report), creating heatmaps of incident failures across the subway system, and more. Despite a lot of frustration along the way, I had an incredible time working at NYCT, but I'm also looking forward to where I'm headed next!