Using pgRouting to Calculate Transit Catchment Areas
In order to show the effects of a grid vs loop and lollipop road network, I downloaded the GTFS files for Ride On bus here. These are simply txt files, with routes, stops, schedule information, and some other details. For this visualization, I also needed a routable network loaded into a PostGIS database. Thankfully, many other people have worked on this issue to make it relatively simple.
Using osm2po to Create a PostGIS Insert Script
The following is mostly from the tutorial on Anita Graser's blog. First of all, we will need to download the binary OSM files for the DC area. Mapzen kindly hosts several metro area extracts, form which I downloaded the DC/Baltimore OSM PBF file. Next, we need to download the osm2po application, which can create a PostGIS insert script from the OSM files. You'll also need to have Java installed to run it (sorry). Extract it, and navigate to the folder with osm2po-core-5.1.0-signed.jar. As of osm2po 5.1, the program no longer automatically generates the PostGIS insert script automatically, so you need to uncomment the following lines (271-287 in the version I have).
postp.0.class = de.cm.osm2po.plugins.postp.PgRoutingWriter
postp.0.writeMultiLineStrings = true
postp.1.class = de.cm.osm2po.plugins.postp.PgVertexWriter
postp.2.class = de.cm.osm2po.plugins.postp.PgPolyWayWriter
postp.3.class = de.cm.osm2po.plugins.postp.PgPolyRelWriter

postp.4.class = de.cm.osm2po.postp.GeoExtensionBuilder
postp.5.class = de.cm.osm2po.postp.MlgExtensionBuilder
postp.5.id = 0
postp.5.maxLevel = 3, 1.0

postp.6.class = de.cm.osm2po.sd.postp.SdGraphBuilder
To create the insert script now, run the command below.
java -jar osm2po-core-5.1.0-signed.jar prefix=at "<path to OSM file>\dc-baltimore_maryland.osm.pbf"
Installing PostGIS
Note: There is a PostgreSQL package in Scoop as well.
The insert script should be in the osm2po folder at osm2po-5.1.0 osm2po-5.1.0\at\at_2po_4pgr.sql. We now have the insert script, but no PostGIS database to insert it into. There are a few different ways to set this up, and I'm going to differ slightly from [Anita Graser's method]. Instead of using a VirtualBox VM with PostGIS, I installed it directly on the local machine, following the instructions on the PostGIS website. First, you need to download the PostgreSQL 9.6.5 installer for Windows x86-64 from EnterpriseDB.
When the PostgreSQL install is finished, the installer should offer to open up Stack Builder. Select your local server and continue. PostGIS is under the "Spatial Extensions" option. I went ahead and created a new spatial database, and clicked yes on all the options that popped up, although you should be more careful if you've got an existing install of PostGIS. This whole process should also install pgAdmin 4, although as of v1.6 it is still so buggy that everybody in my office uses pgAdmin 3 instead.
Loading in the Road Network
Navigate to your PostgreSQL install, e.g. C:\Program Files\PostgreSQL\9.6\bin where psql.exe is located. The general format for your command is below, although you can find a more detailed template in osm2po-5.10\at\at_2po.log. Personally, I prefer to remove the -q, which is quiet mode.
psql -U <username> -d <database name> -q -f "<sql insert path>"
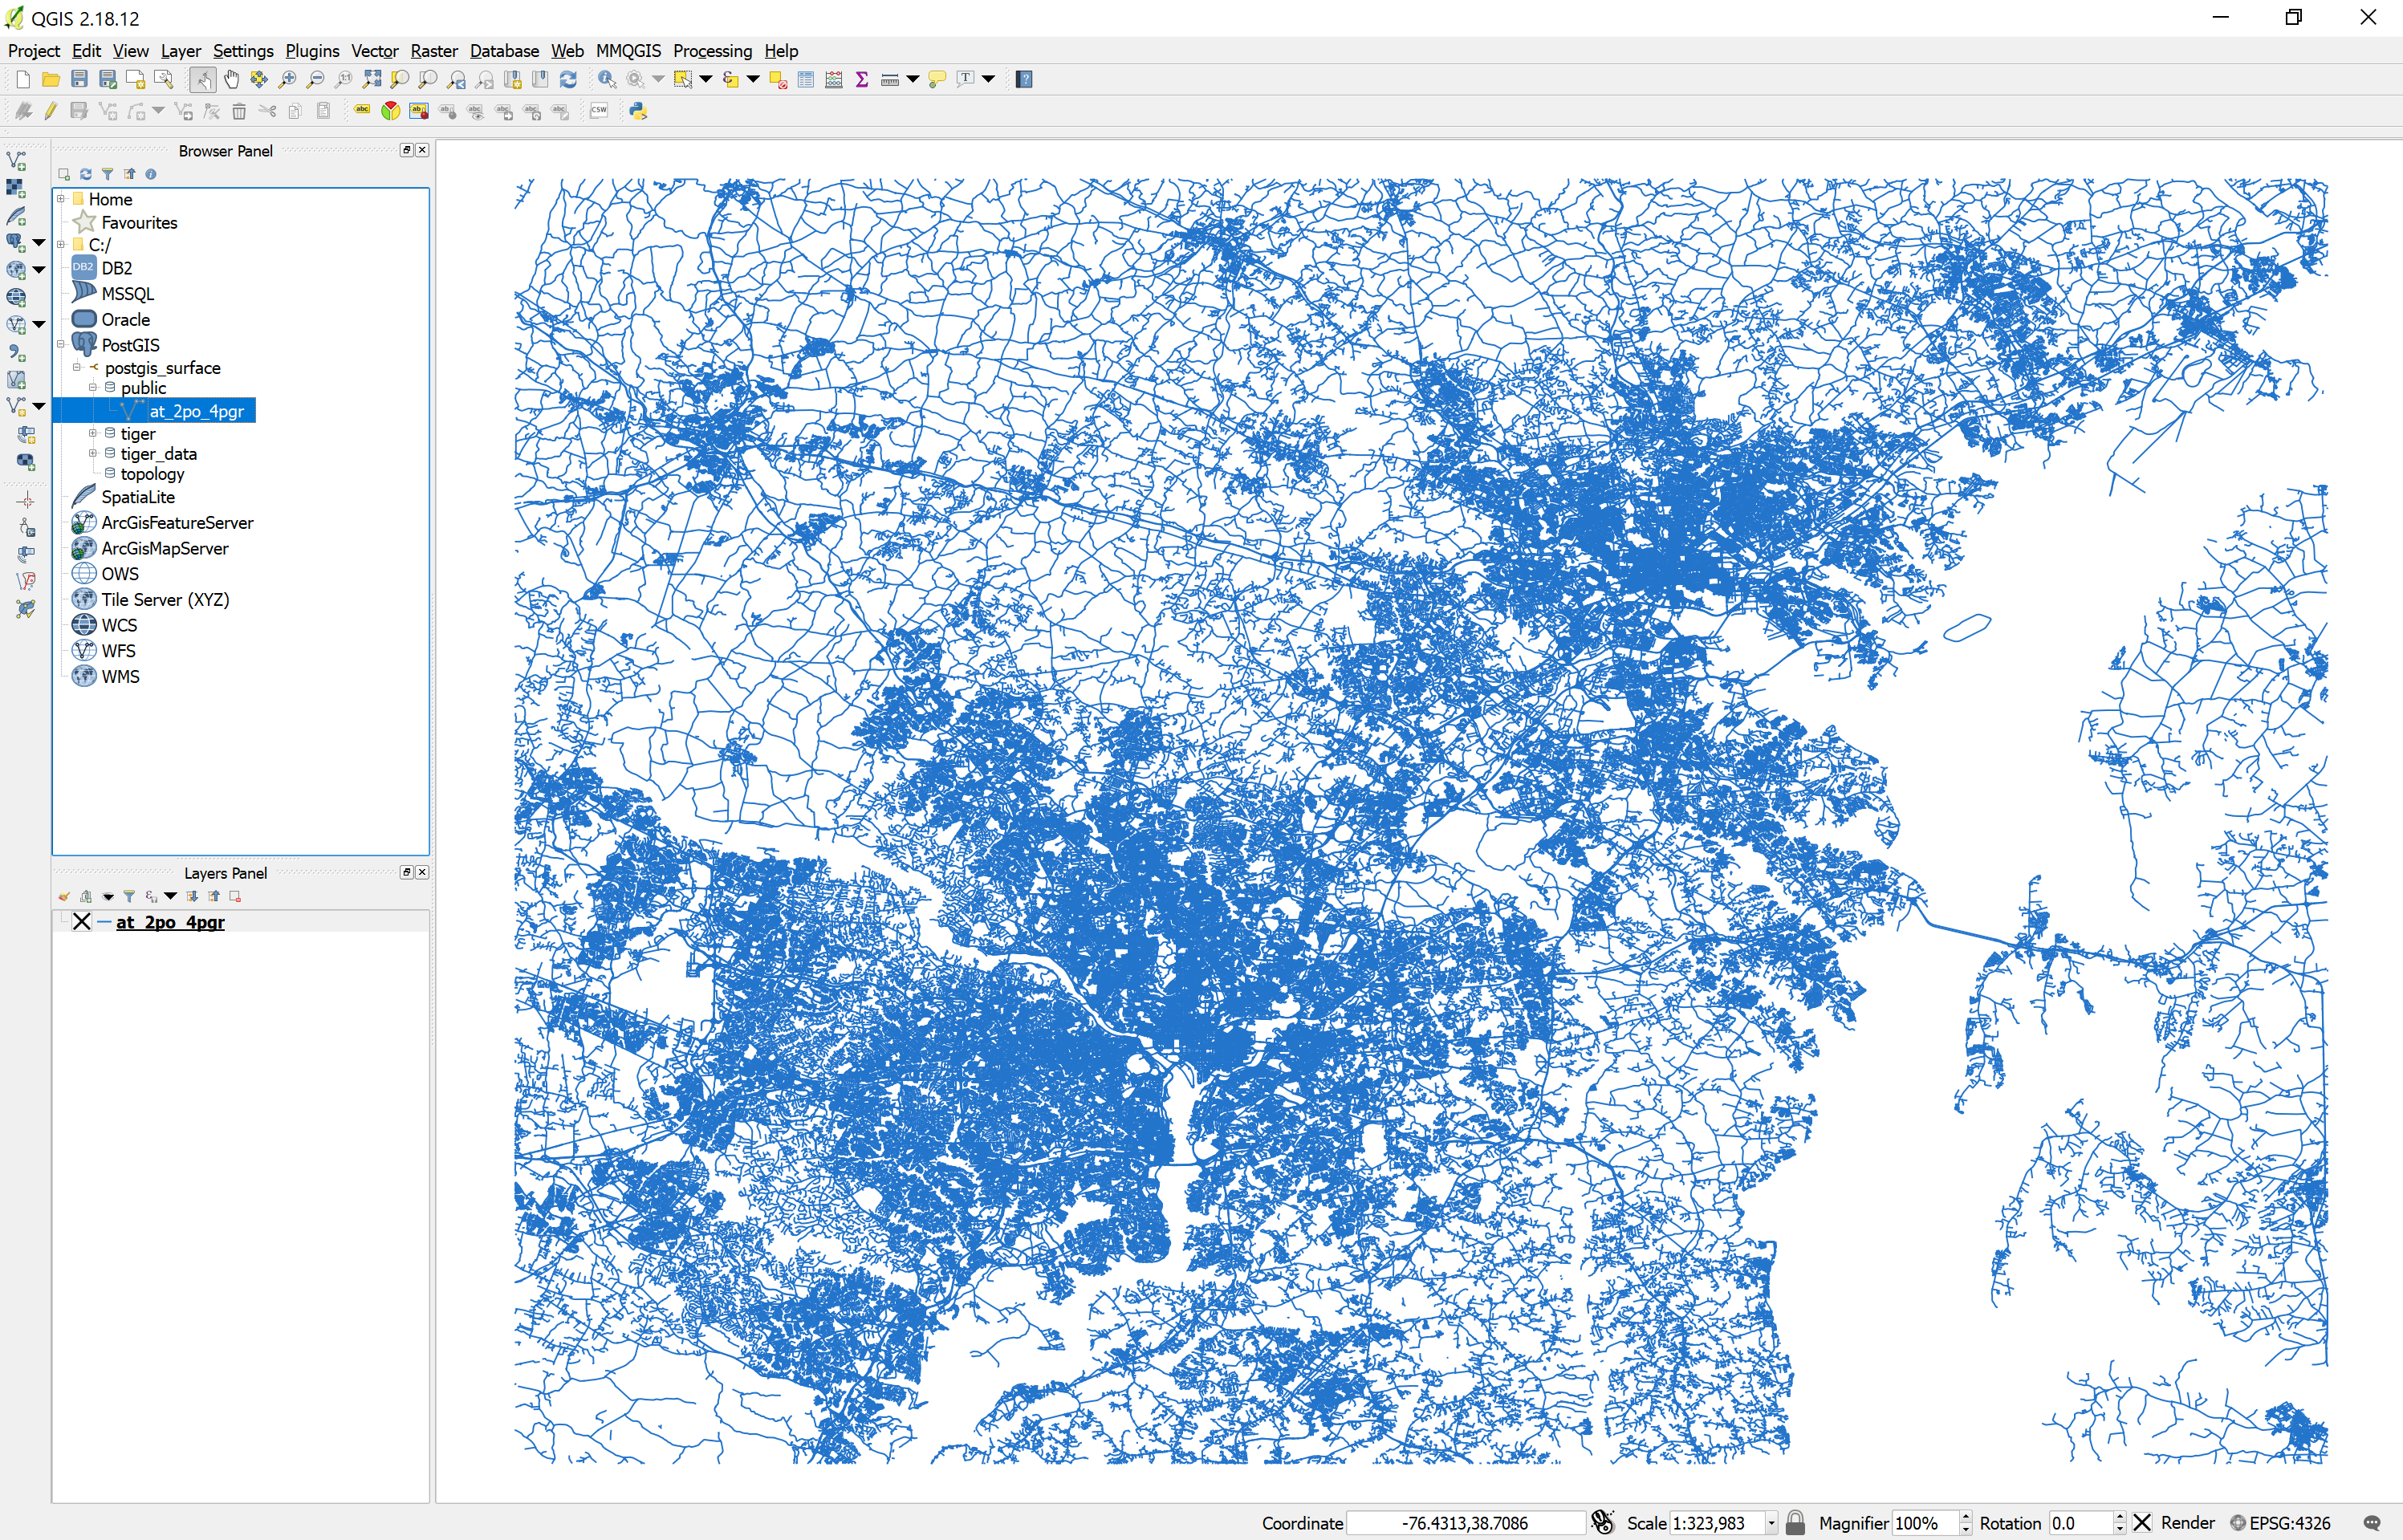
Hopefully everything went according to plan, although it should be easy to check in the next step. Open up QGIS and start a new project. Double click on PostGIS in the browser panel and you should see your database if it is running locally. In the public schema, there should be a new table called at_2po_4pgr. If you drag the table into the map canvas, you should see the road network, like in the photo below.
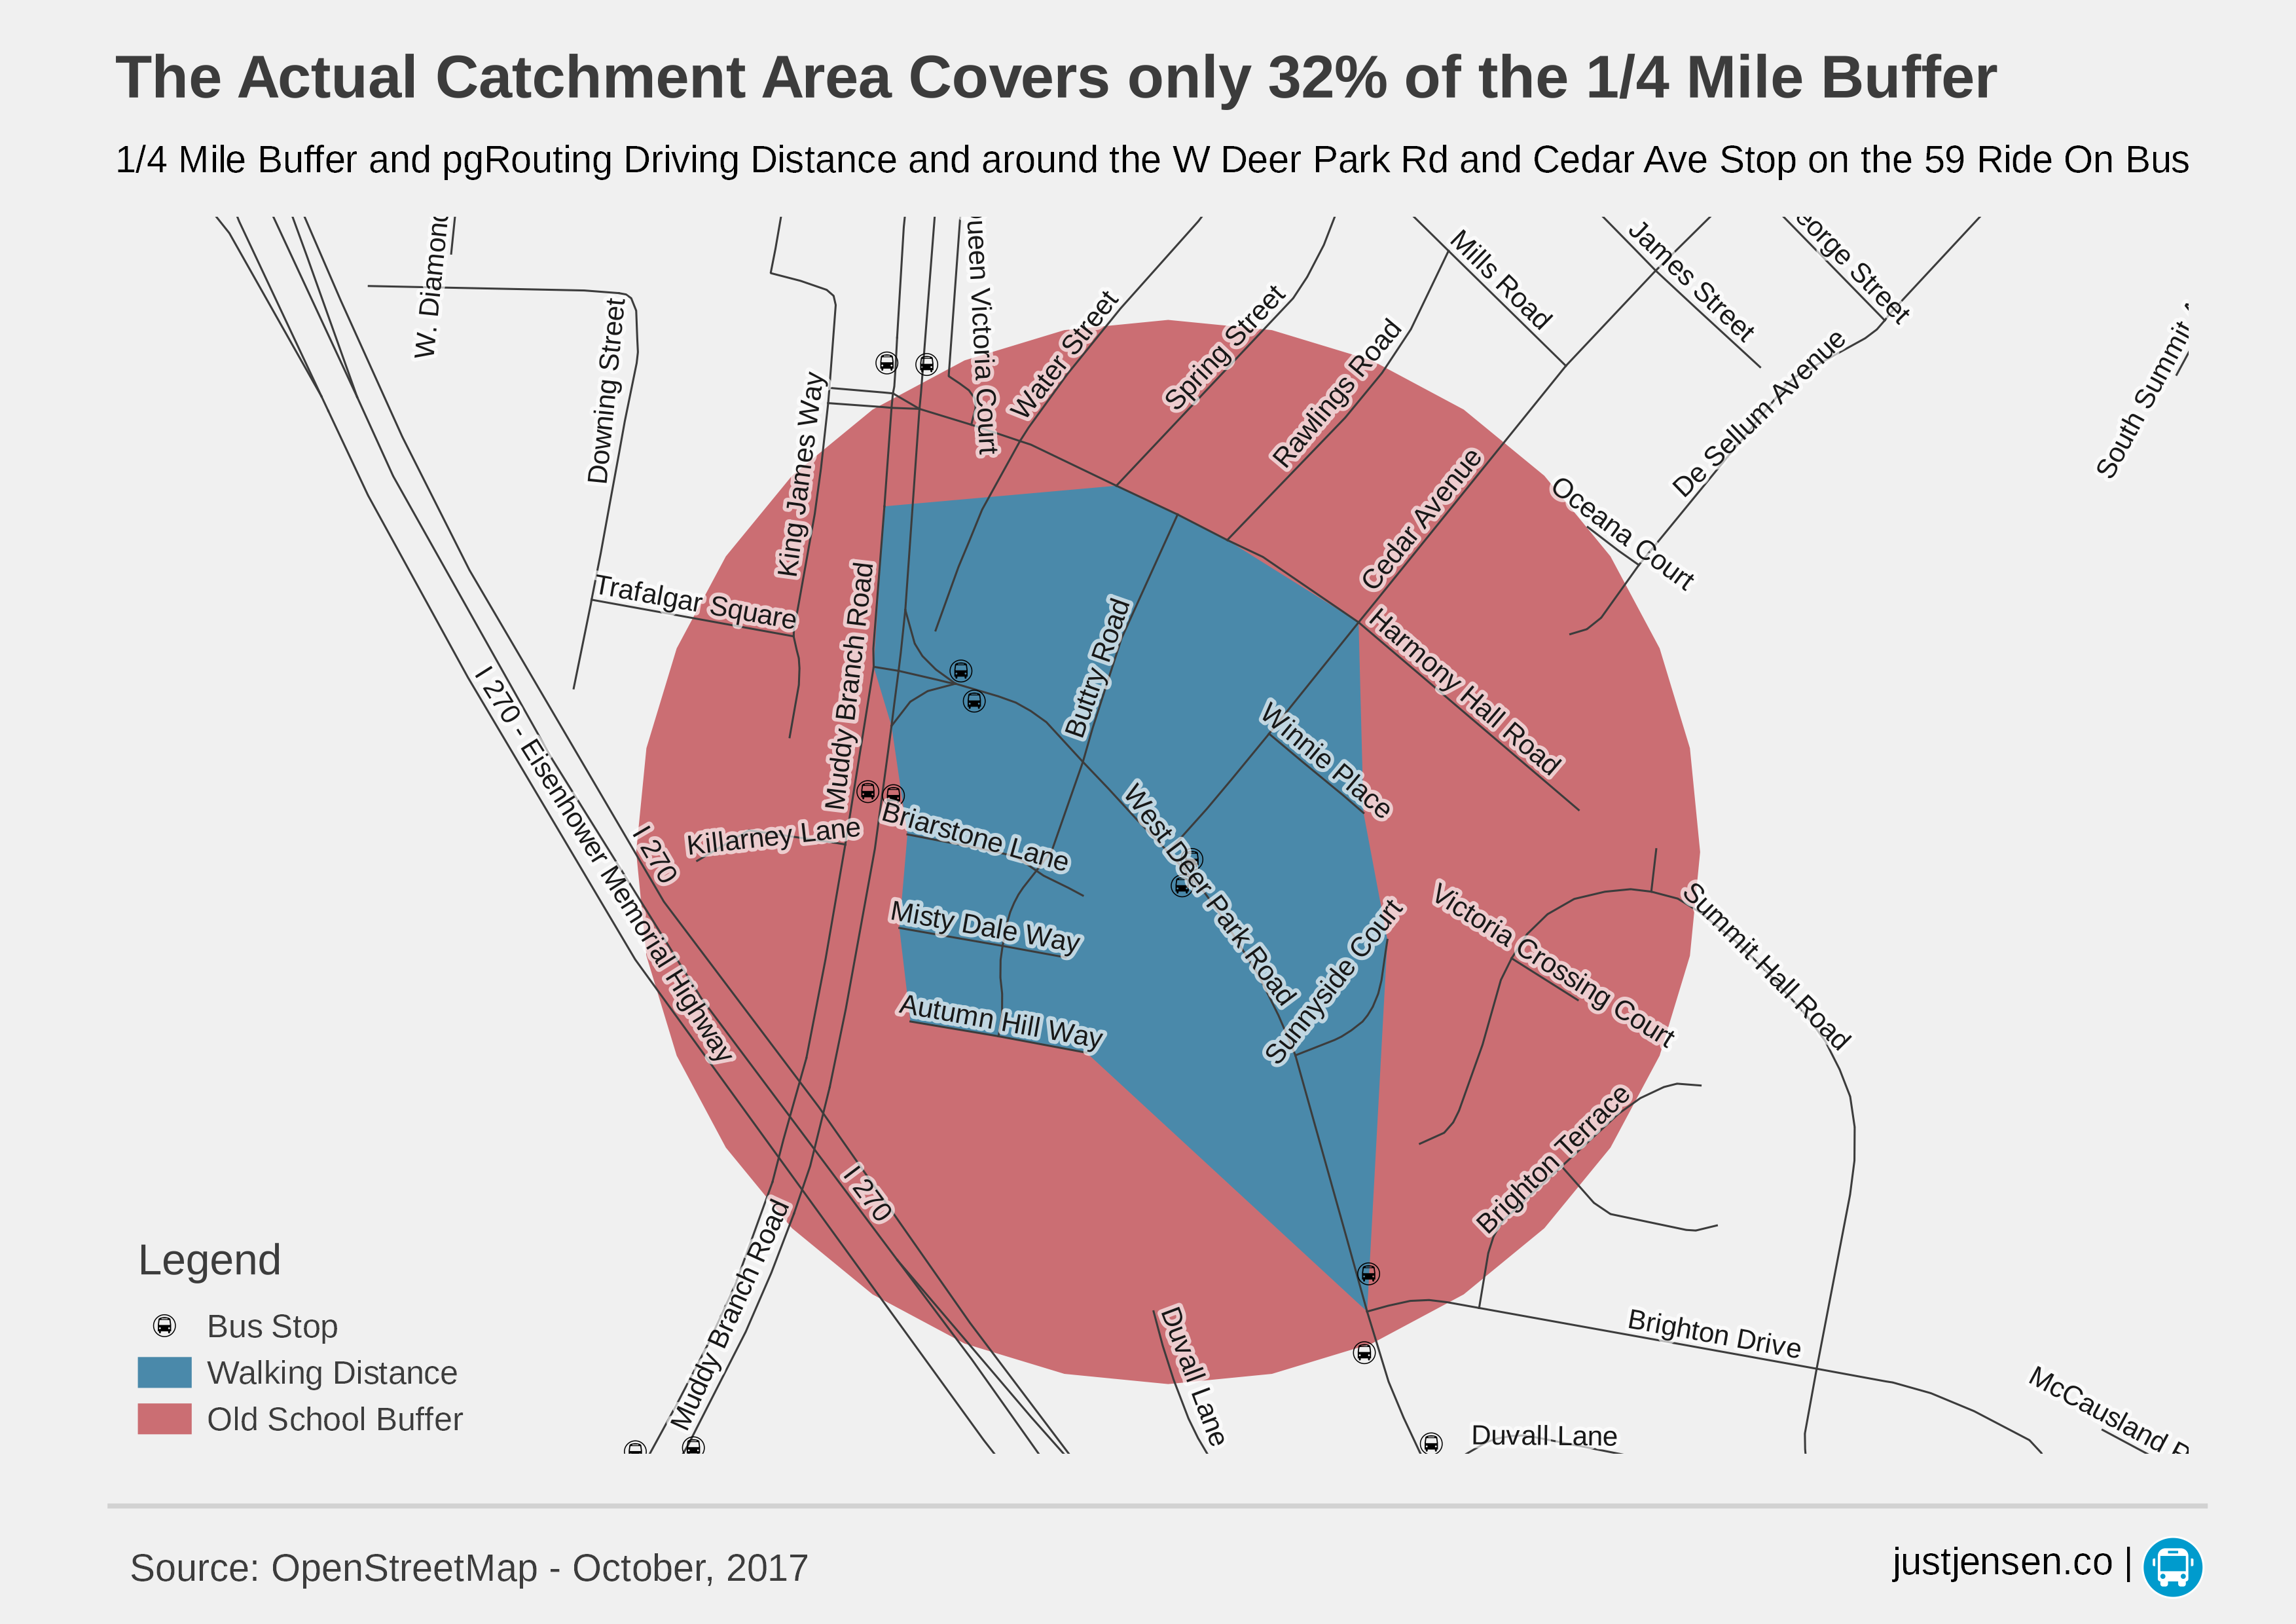
Applying the Quarter Mile Rule to a Bus Stop
In order to evaluate the quarter mile rule, we need to find a way to travel a quarter mile from a given bus stop. The OSM table has values in kilometers, which corresponds to about 400 meters instead of a quarter mile. We also need a starting vertex. As a starting example, we'll look at the stop on the 59 bus at W Deer Park Rd and Cedar Ave (I picked this stop by looking at Gaithersburg and looking for loops and lollipops). Assuming you have set up everything as I have, the intersection has a node id of 36453. With this information, we can use the pgr_drivingDistance function to find the walking catchment area. The link explains the function pretty well, which leads to the query below.
SELECT *
  FROM pgr_drivingDistance(
       'SELECT id, source, target, km AS cost FROM at_2po_4pgr',
       36453, 0.4, false);
Simple right? A strange quirk of pgr_drivingDistance is that the first argument is a string with the SQL code inside it that defines the edge ID, the source vertex, the target vertex, and uses the distance as the cost (see this Wikipedia entry on graph theory for more info on the vocabulary here).
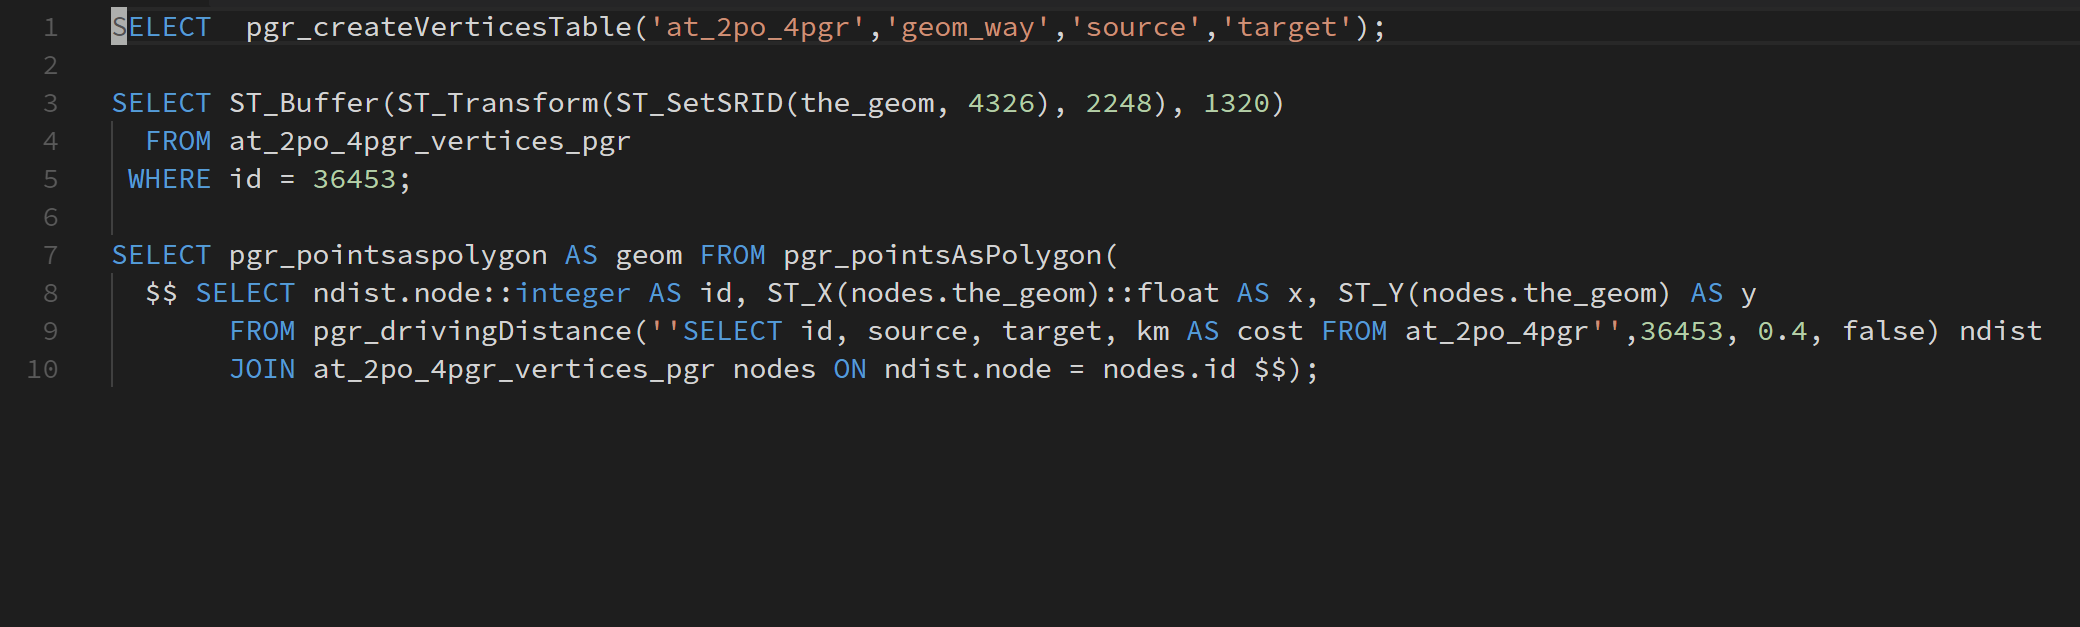
In addition to the pgRouting method, we also need to use the old circular buffer method as a comparison point. To do this, we will first create a vertices table so we can easily select the node. If you created your topology table in any other way, you probably already have this table. After creating it, we can create a buffer around the point using the query below. It took about a minute on my Surface Book.
SELECT pgr_createVerticesTable('at_2po_4pgr','geom_way','source','target');
With this new vertices table, we can create a buffer around the intersection. The typical way to do this would be to make the buffer around the bus stop itself, but this should make for a more direct comparison of the two methods. To create the buffer (do not use this function just to test whether a feature falls within a certain distance of another feature).
SELECT ST_Buffer(ST_Transform(ST_SetSRID(the_geom, 4326), 2248), 1320)
  FROM at_2po_4pgr_vertices_pgr
 WHERE id = 36453
You can add these layers to QGIS using Database -> DB Manager -> DB Manager. All that is left now is the styling.
Visualizing the Results
Current versions of QGIS can create layers purely based on PostGIS queries, which makes it easy to visualize the results. The only addition is to add a polygon based on the nodes that are within walking distance of the bus stop.
SELECT pgr_pointsaspolygon AS geom FROM pgr_pointsAsPolygon(
  $$ SELECT ndist.node::integer AS id, ST_X(nodes.the_geom)::float AS x, ST_Y(nodes.the_geom) AS y
       FROM pgr_drivingDistance(''SELECT id, source, target, km AS cost FROM at_2po_4pgr'',36453, 0.4, false) ndist
       JOIN at_2po_4pgr_vertices_pgr nodes ON ndist.node = nodes.id $$)
This creates an alpha shape, which we are using here to visualize the catchment area. It is worth noting that there is currently a bug in pgr_pointsAsPolygon that the developers will fix in v3.0, which is why the query needs the double quotation marks. Other pgRouting functions only need a single quotation mark.
After applying some styling, we get the map below!